
The Latest UK CAPE Forecast Charts...
Convective Available Potential Energy (CAPE) is measure of the amount of energy available for convection. CAPE is directly related to the maximum potential vertical speed within an updraft; thus, higher values indicate greater potential for severe weather. Convective Available Potential Energy (CAPE) and Lifted Index (LI) charts are used to forecast the likelihood of thunderstorms. Forecast CAPE values are shown by the coloured shading with yellows, oranges and reds indicating a progressively increasing chance of thunderstorms. LI is shown by the contours with values below 0 indicating greater instability and an increasing chance of thunderstorms.
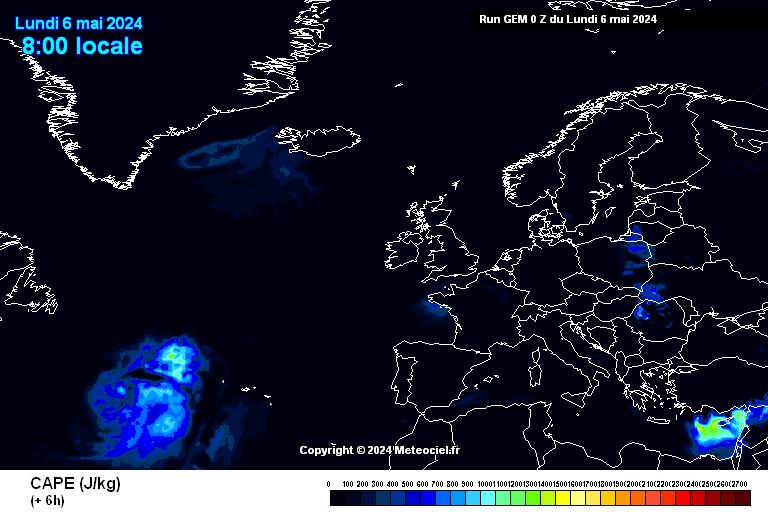

CAPE Forecast Chart +3:00hrs from this morning.
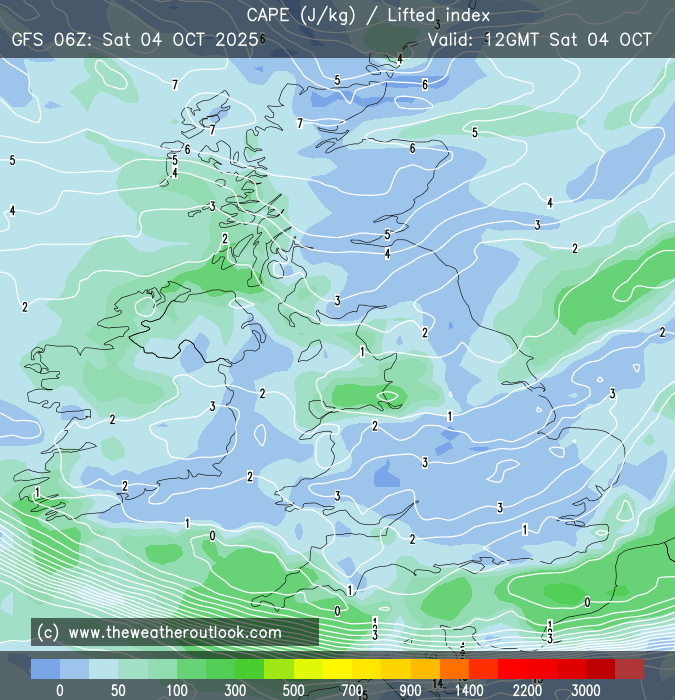
CAPE Forecast Chart +6:00hrs from this morning.
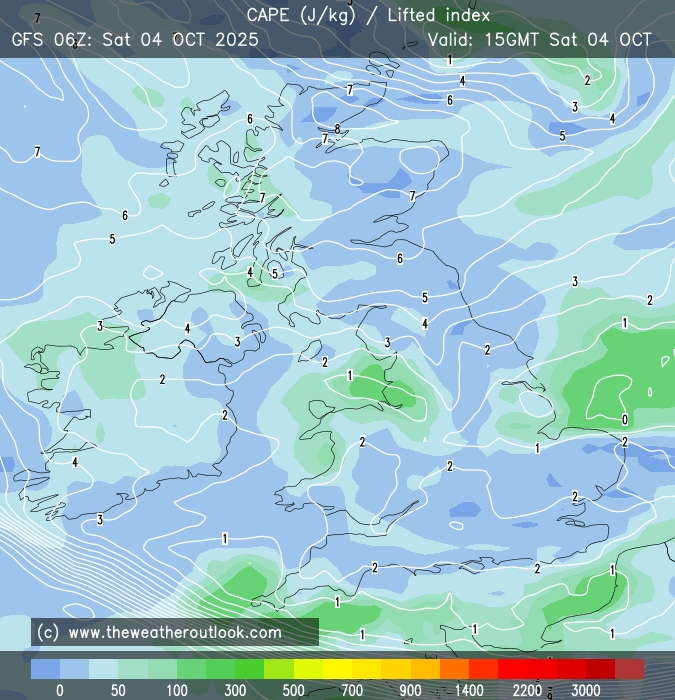
CAPE Forecast Chart +9:00hrs from this morning.
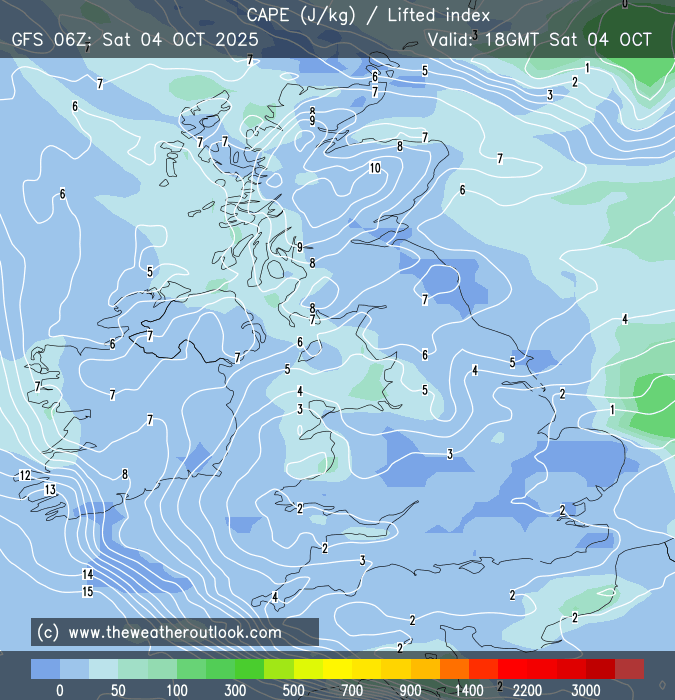
CAPE Forecast Chart +12:00hrs from this morning.
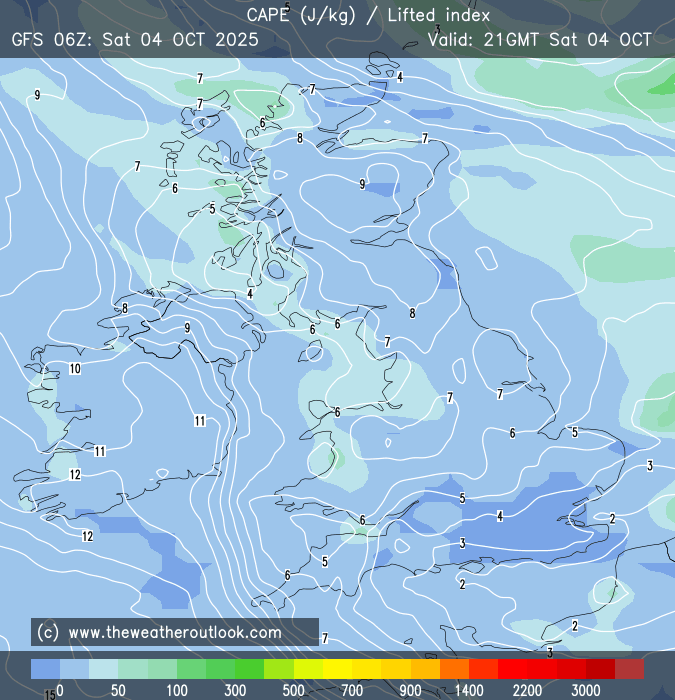
CAPE Forecast Chart +15:00hrs from this morning.
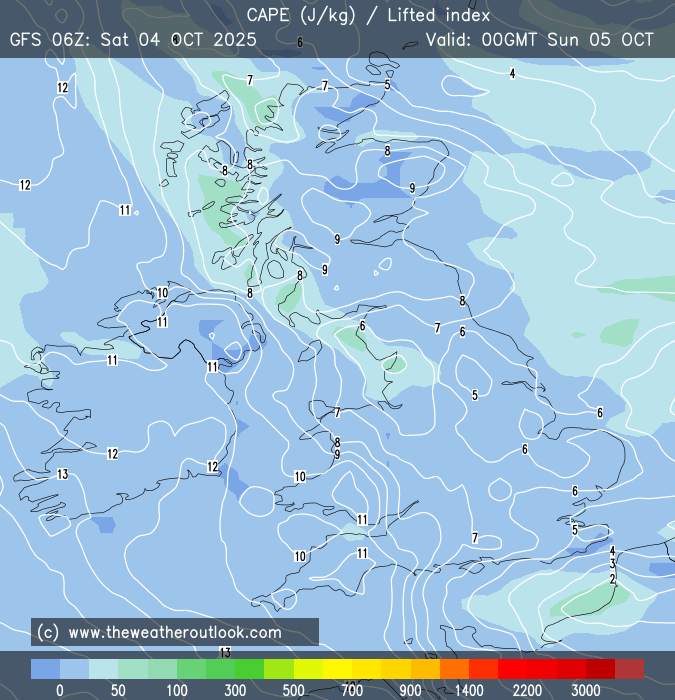
CAPE Forecast Chart +18:00hrs from this morning.
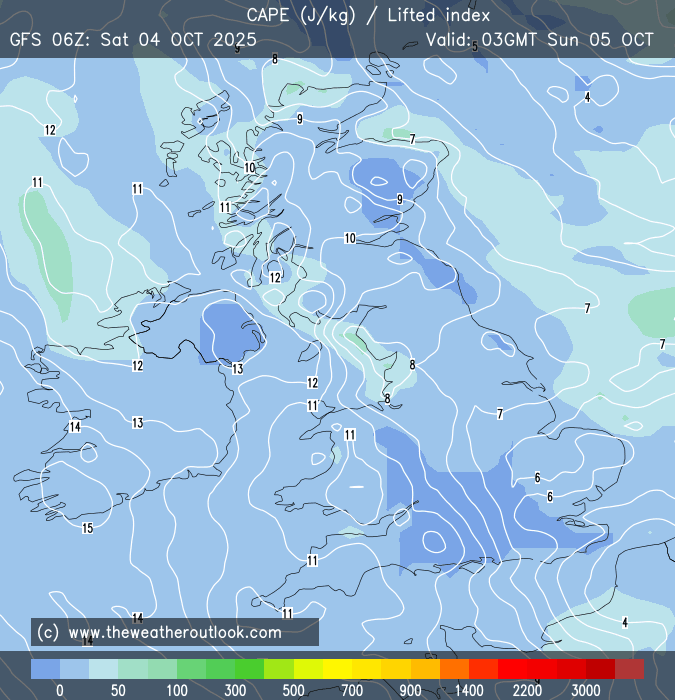
CAPE Forecast Chart +21:00hrs from this morning.
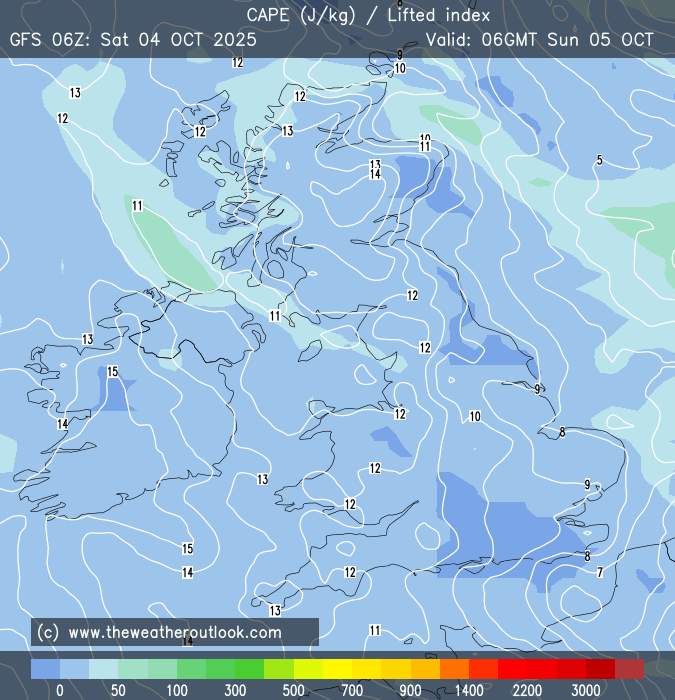
Images are updated at regular intervals - courtesy of theweatheroutlook.com


