Graphs and Trends
Delerius Weather Stations Latest Statistical Graphs.
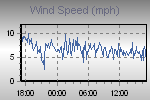
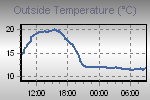
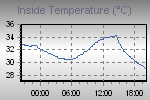
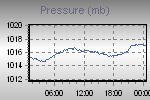
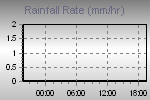
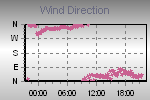
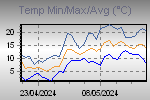
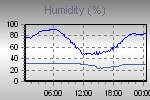
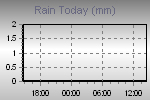
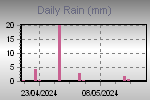
These Graphs Represent Temperature, Pressure, Rainfall Wind Speed and Sunlight Trends for the Last 24 Hours .
These Thumbnail Graphs are Sampled Every 12 minute.s. Click on a Thumbnail to Display the Corresponding Enlarged Graph. The Enlarged Graphs are Sampled Every minute..
Page Updated : 28/04/2024 13:41:00
Powered by Cumulus 1.9.4 (10992)


